



















Power BI Dashboard Development Services
Create interactive and visually compelling dashboards to monitor key metrics and business performance in real-time. Transform complex business data into intuitive, interactive dashboards that provide real-time visibility into performance, operations, and growth opportunities.
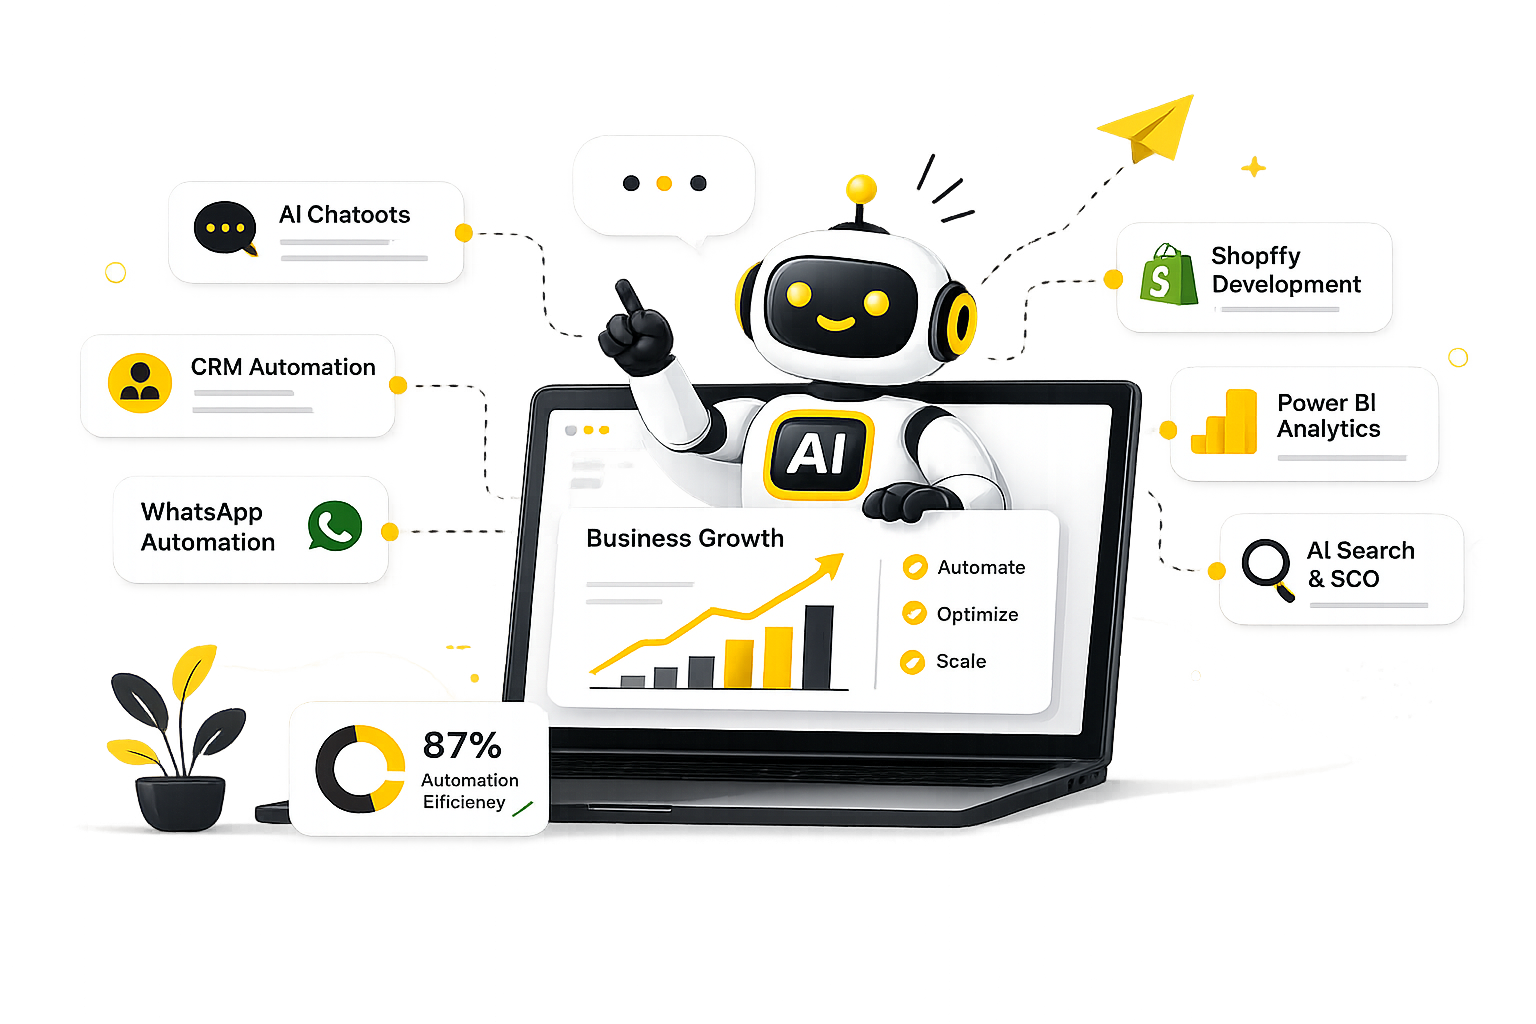
Transform Business Data Into Competitive Advantage
Modern organizations rely on data from sales, finance, operations, marketing, customer service, and countless business applications. Without a centralized reporting system, decision-makers often struggle with spreadsheet-based reporting, delayed insights, inconsistent KPIs, data silos, manual reporting processes, and limited operational visibility.
Our Power BI Dashboard Development services provide a centralized reporting environment that transforms raw data into meaningful business intelligence. Businesses seeking a broader analytics strategy often combine Power BI reporting with AI Business Intelligence solutions to improve decision-making and executive visibility.

What You Gain With Power BI Dashboards
Deliver real-time insights and actionable intelligence to drive better business outcomes
Real-time Visibility
Monitor business performance instantly with live dashboards and KPI tracking
Interactive Visualizations
Create compelling visual representations that make data easier to understand and actionable
Automated Reporting
Eliminate manual reporting processes and save teams valuable time on data consolidation
Data Integration
Consolidate information from multiple systems into a single source of truth
Executive Dashboards
Provide leadership with comprehensive visibility into business metrics and performance
Better Decision-Making
Enable faster, more confident decisions with timely, accurate insights
Scalable Solutions
Build dashboards that grow with your organization and handle increasing data volume
ROI Optimization
Improve business performance through data-driven insights and strategic optimization
Common Challenges We Help Solve
Overcome obstacles that prevent your organization from leveraging data effectively
Manual Reporting Workflows
Teams spend hours building reports instead of acting on insights. Manual processes introduce errors, delays, and inconsistencies that undermine decision-making.
Lack of Real-Time Visibility
Business leaders need access to performance metrics as they happen. Delayed reporting limits responsiveness and prevents real-time operational adjustments.
Inconsistent Reporting
Different departments often work from different versions of business data. This fragmentation creates confusion and undermines organizational alignment on key metrics.
Disconnected Data Sources
Information spread across multiple systems makes reporting difficult. Without consolidation, organizations lose visibility and waste resources on manual data gathering.
Limited Data Accessibility
Complex reports make it difficult for teams to quickly identify actionable insights. Data accessibility should enable faster discovery and decision-making.
Our Power BI Dashboard Development Services
Comprehensive dashboard solutions for every business need
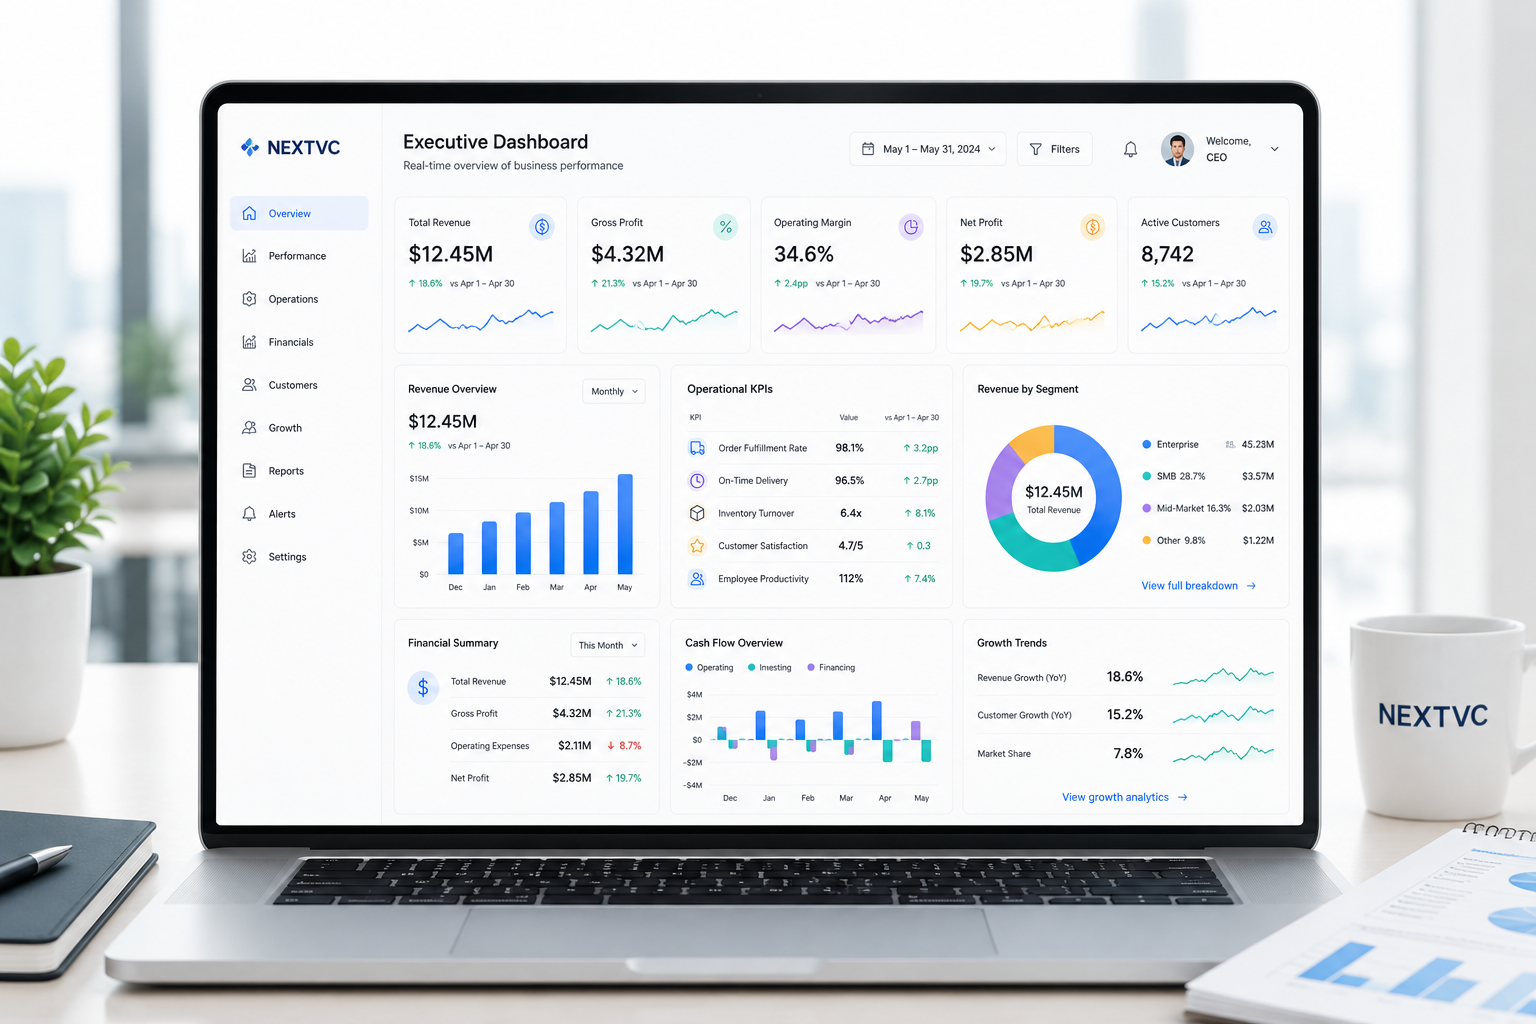
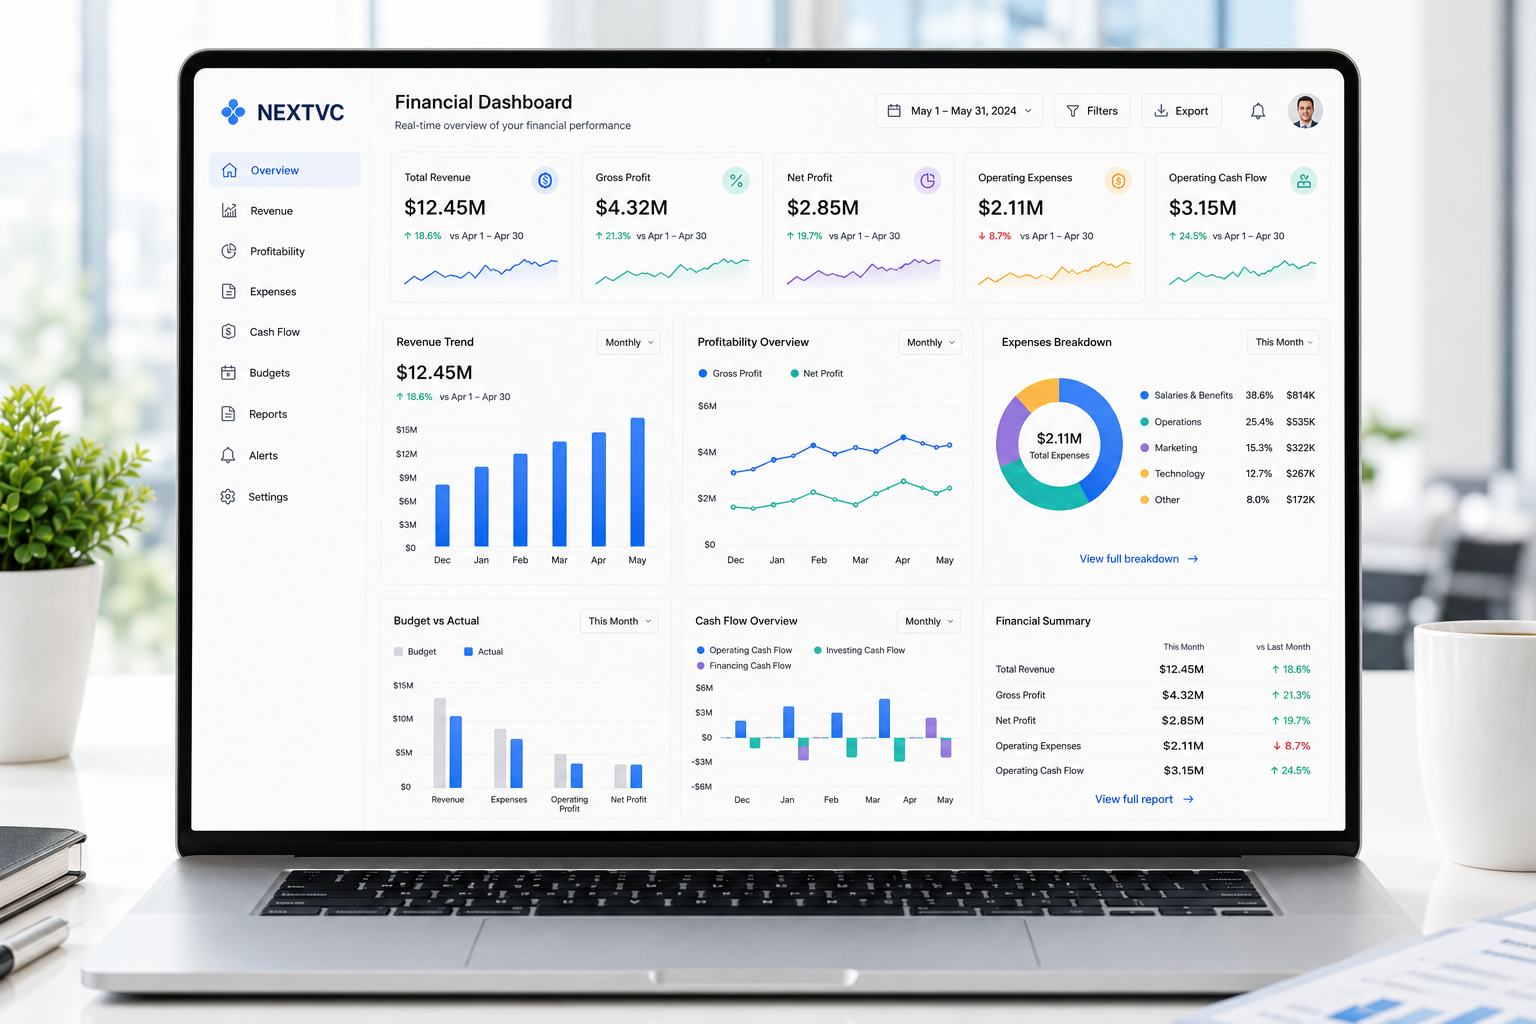
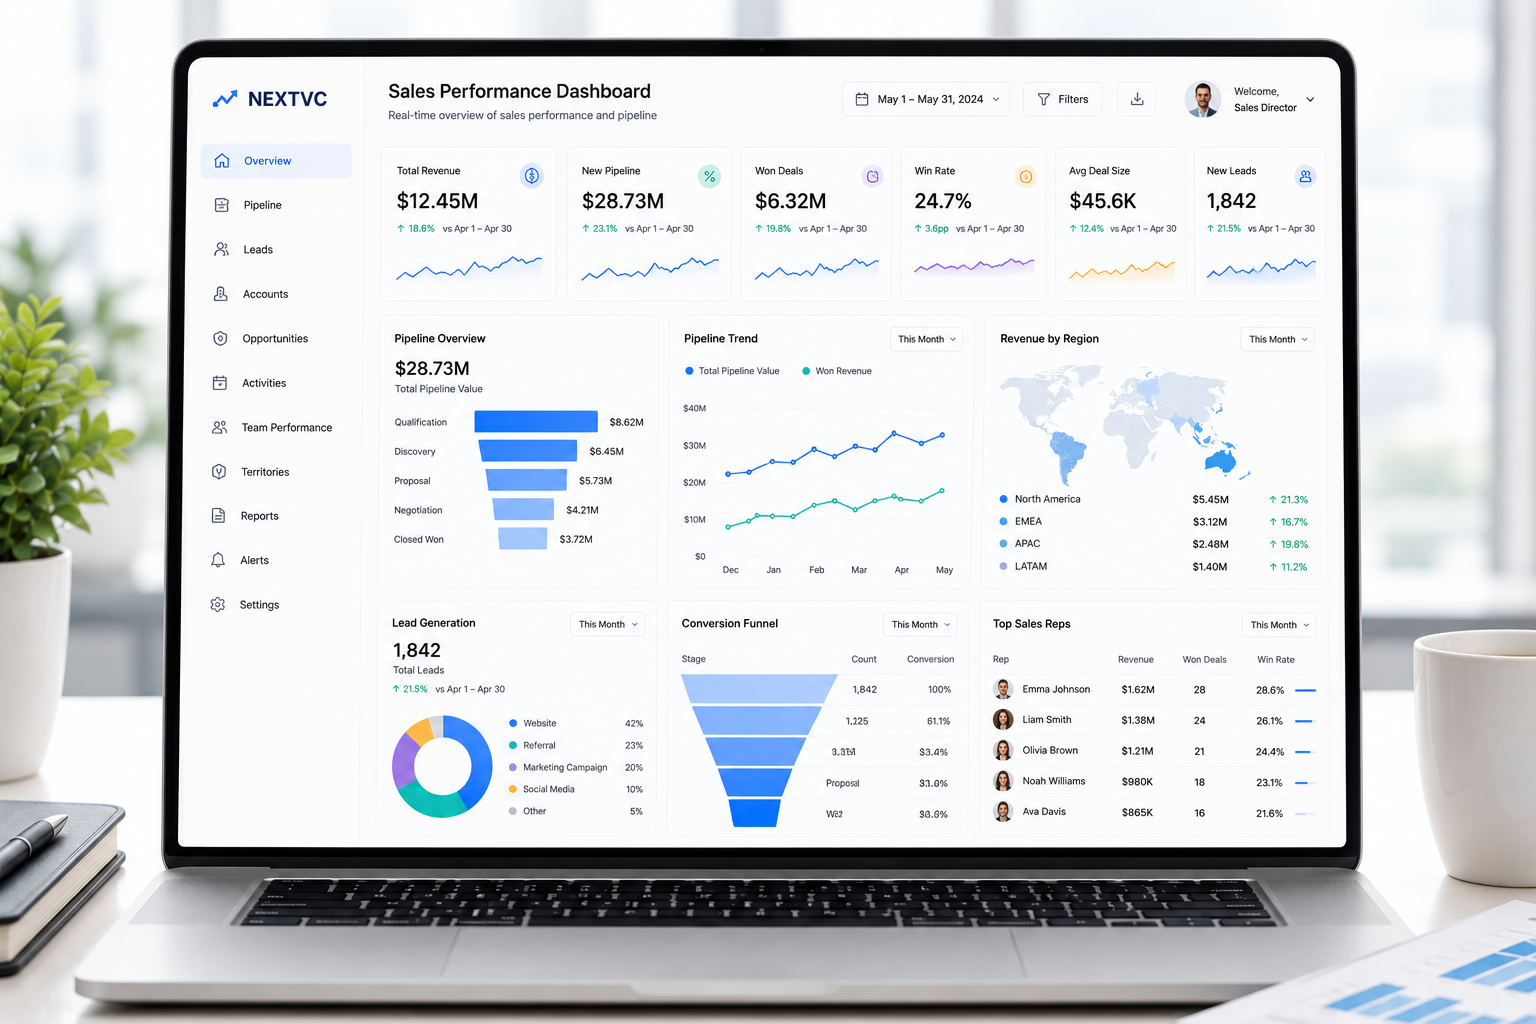
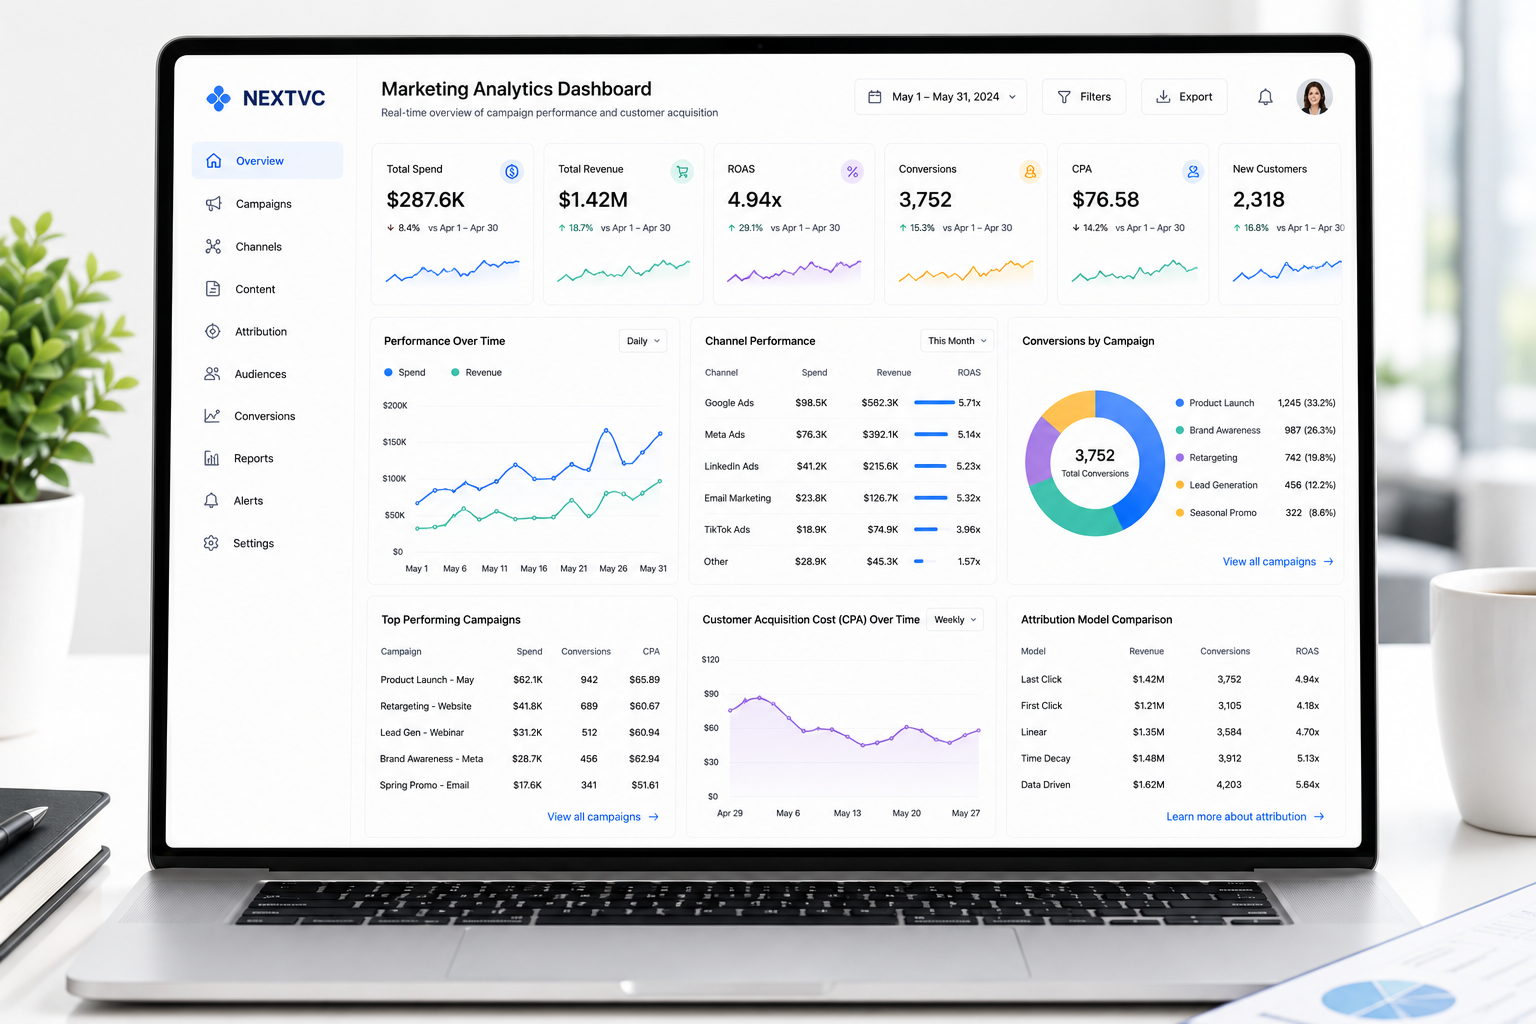
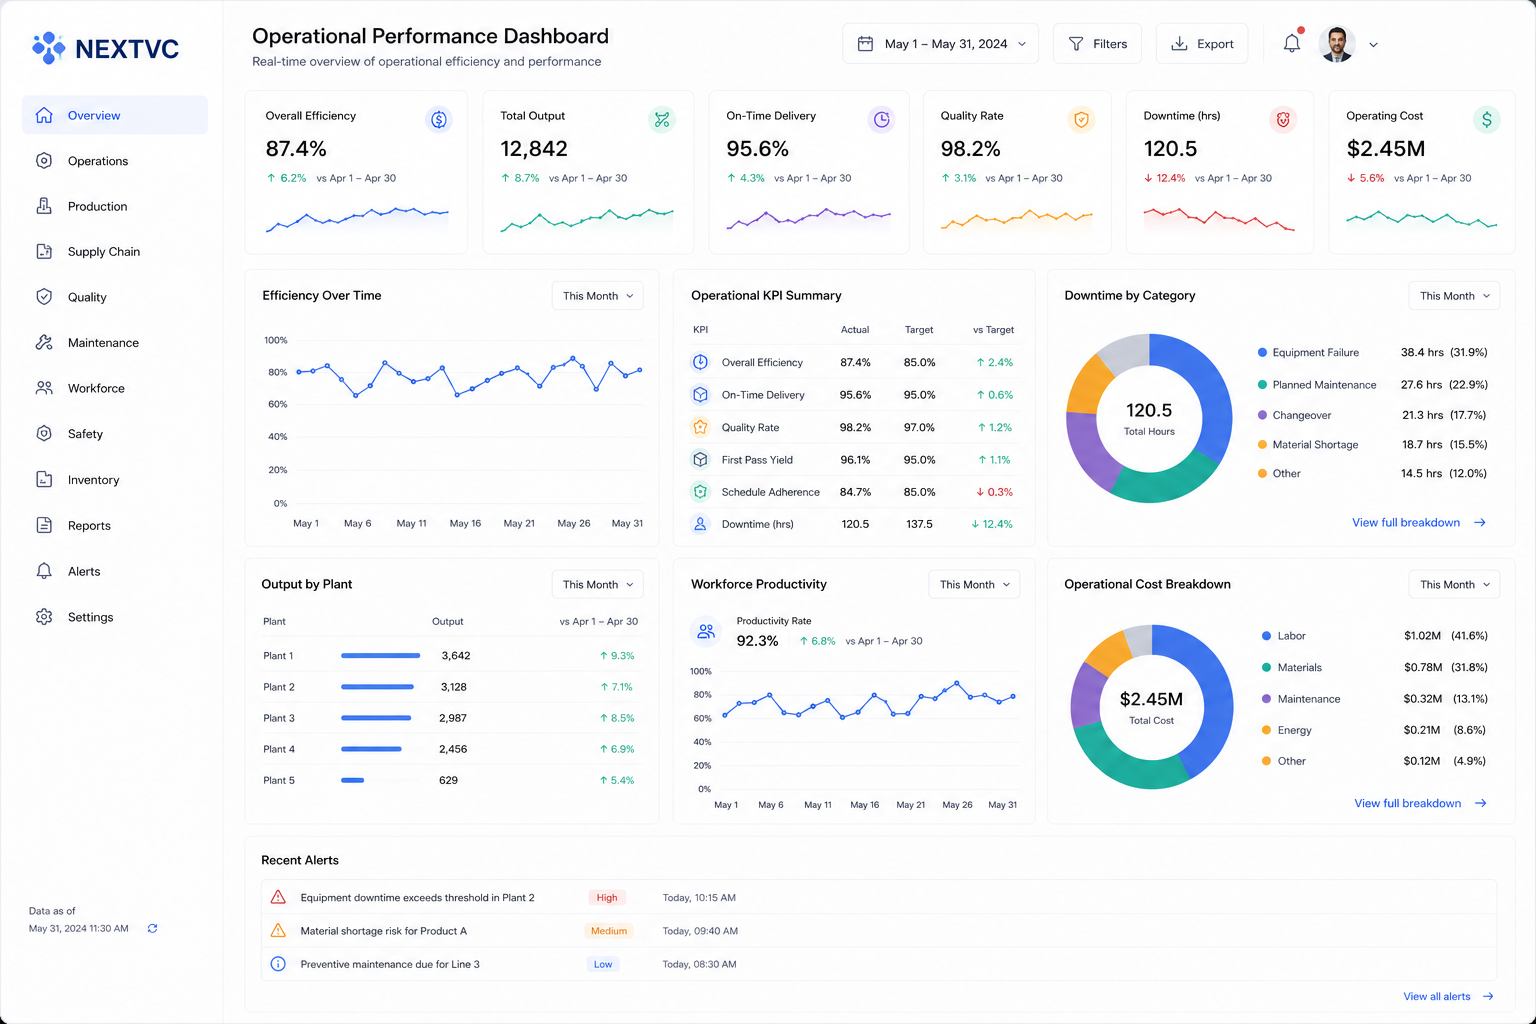
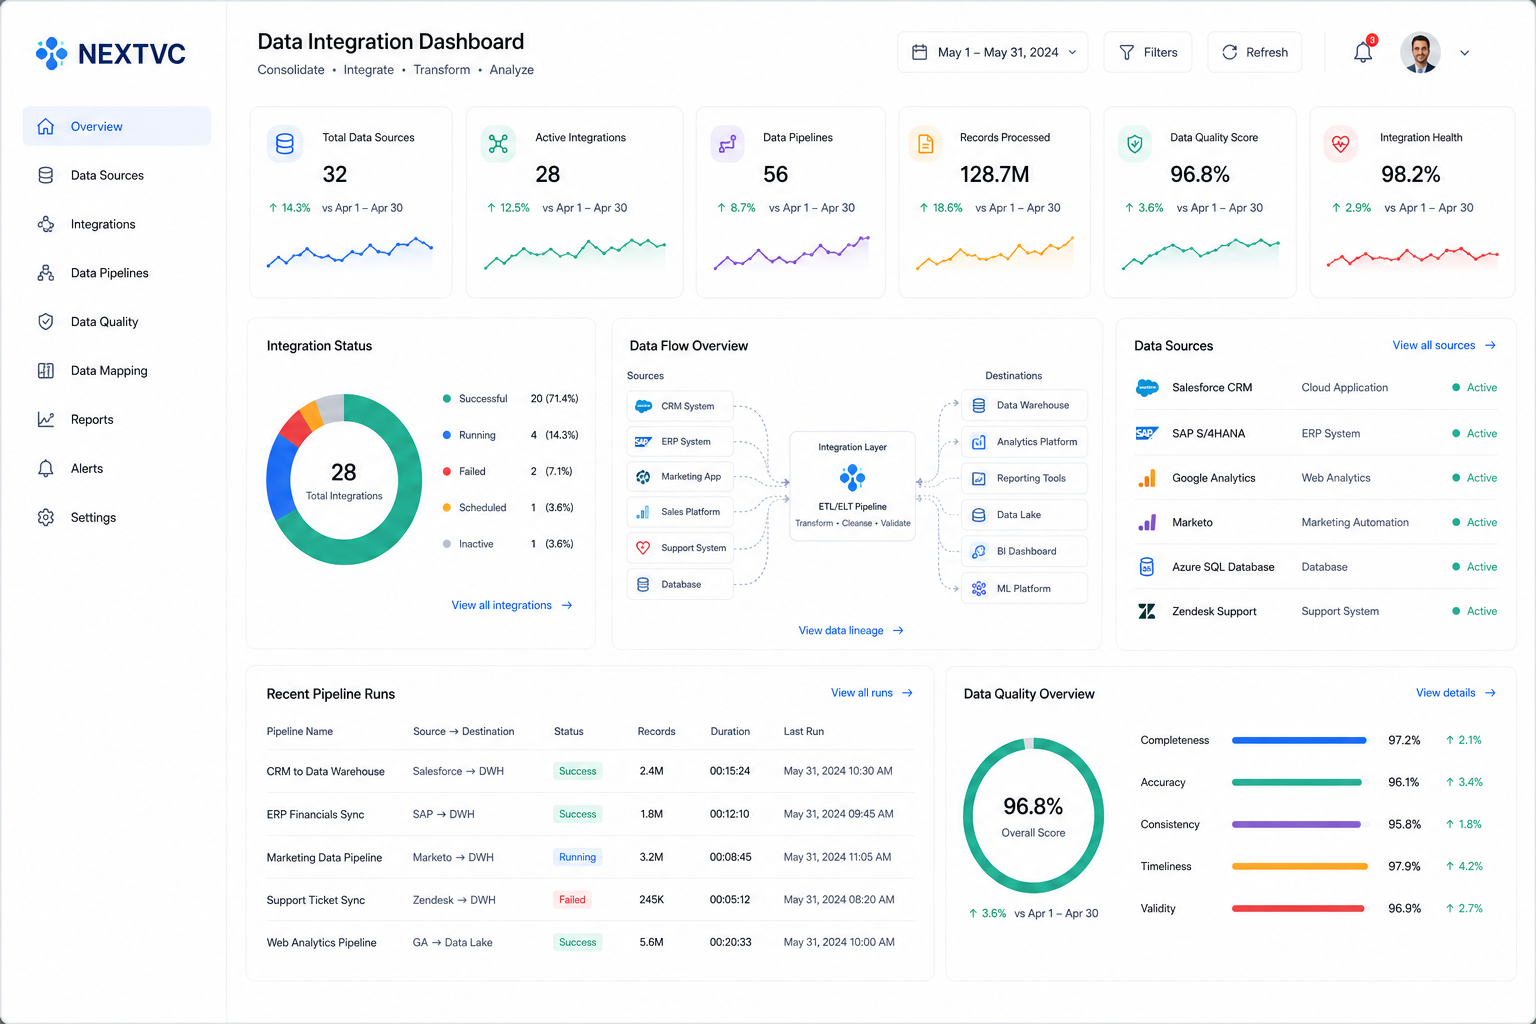
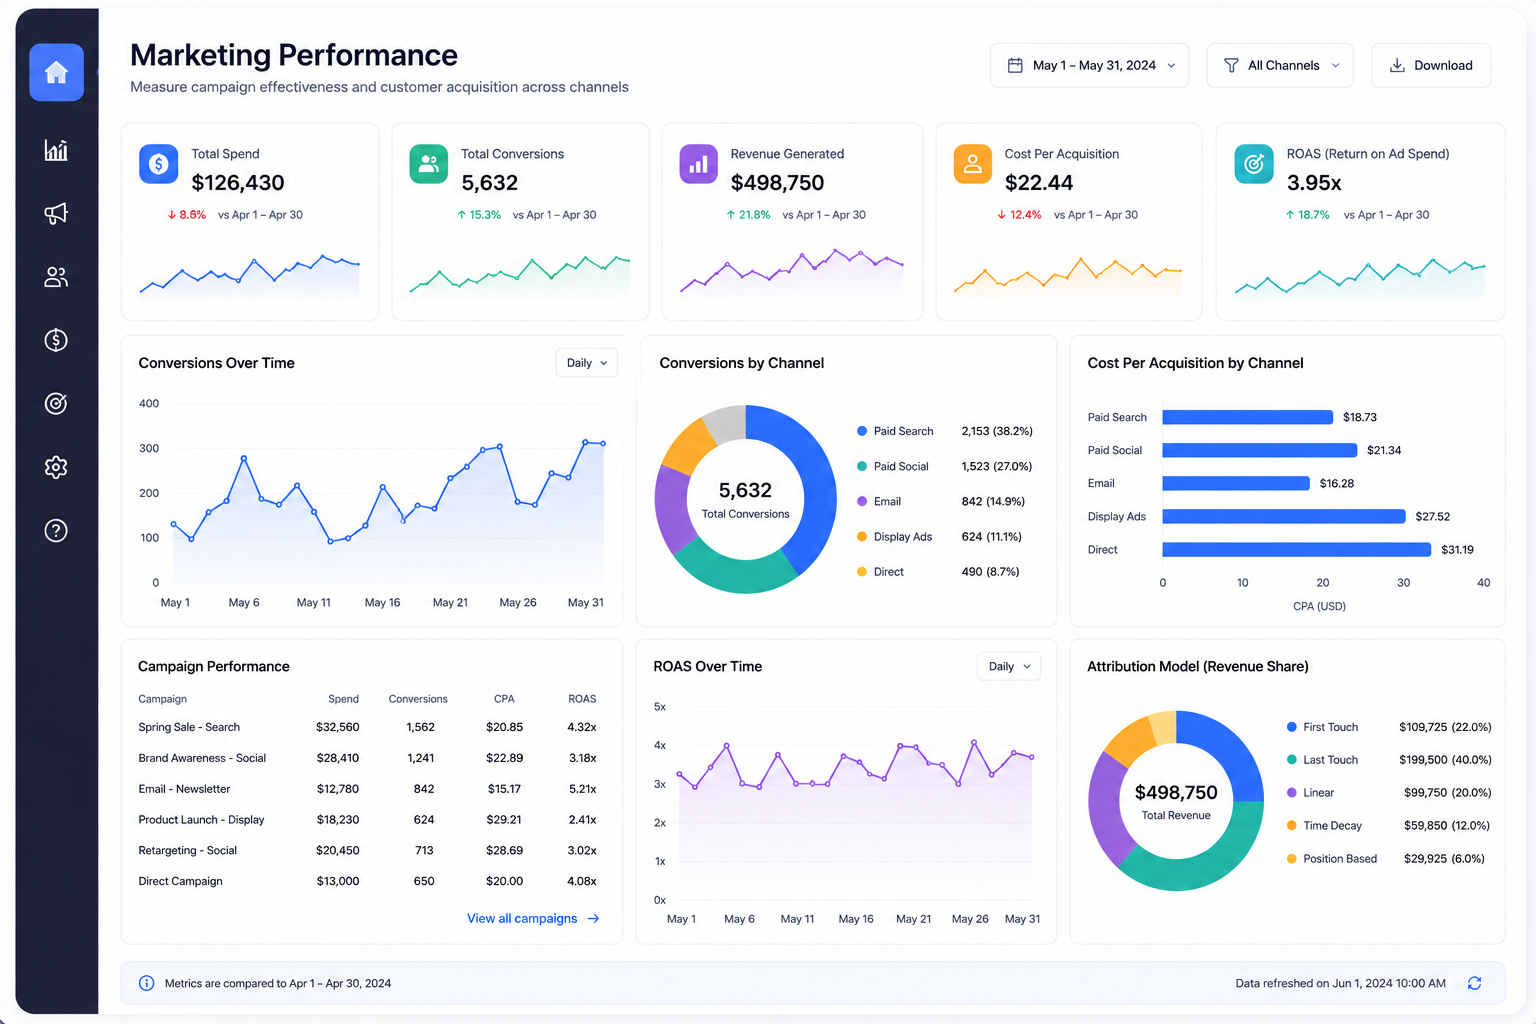
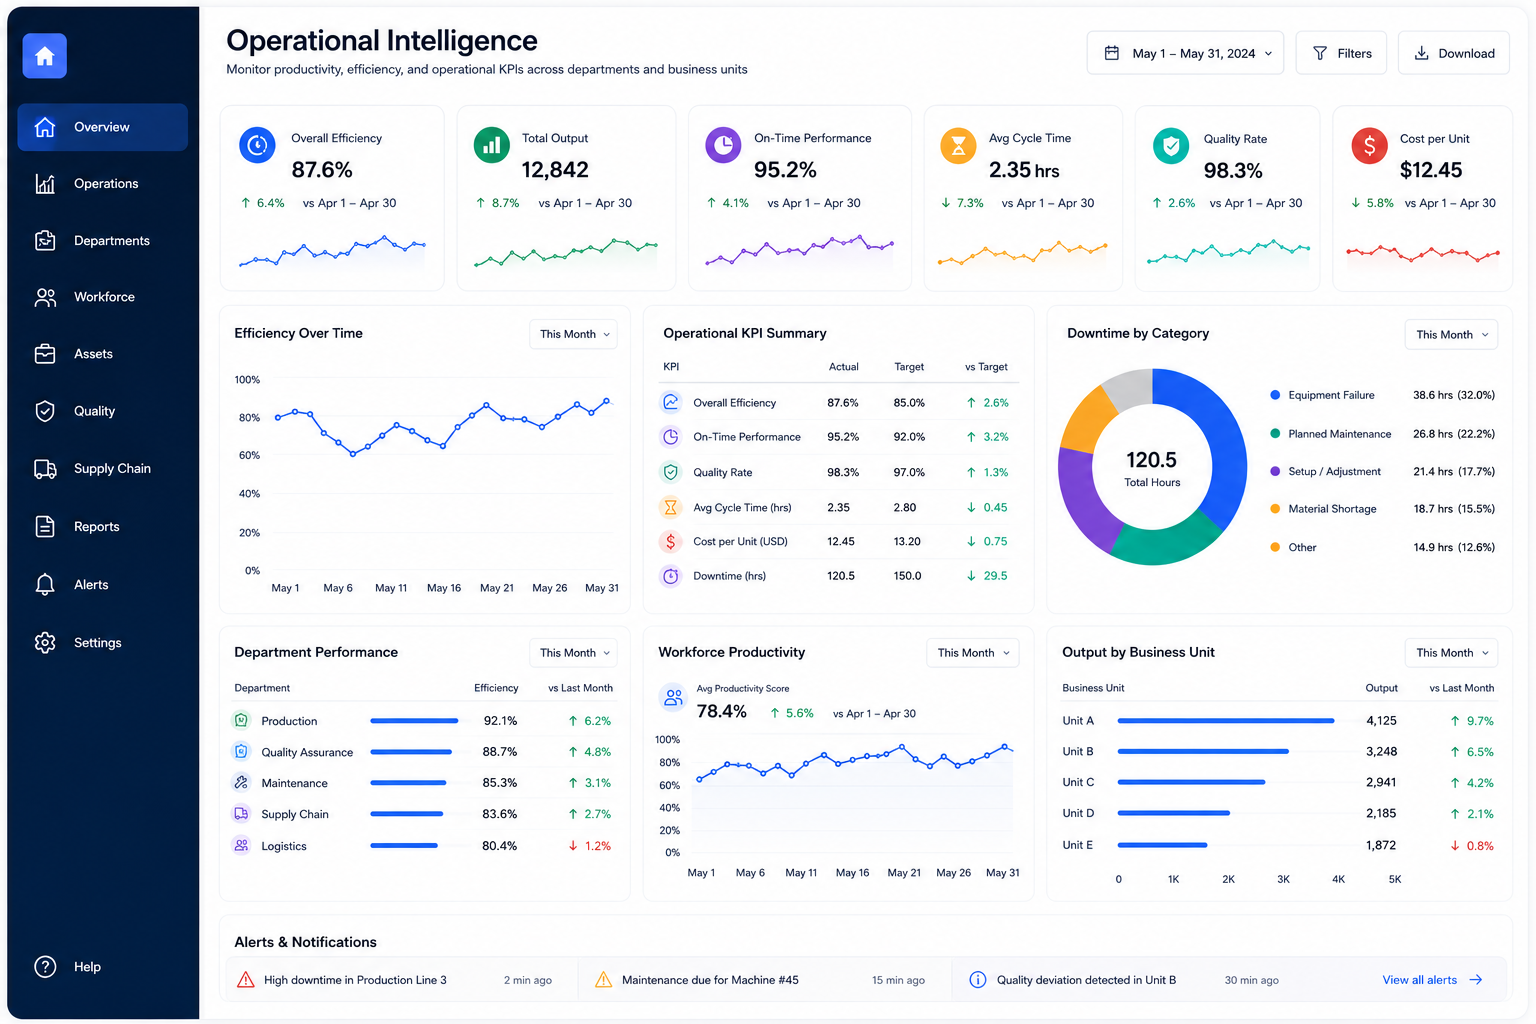
Power BI Dashboard Use Cases
Explore real-world applications of Power BI dashboards across different industries
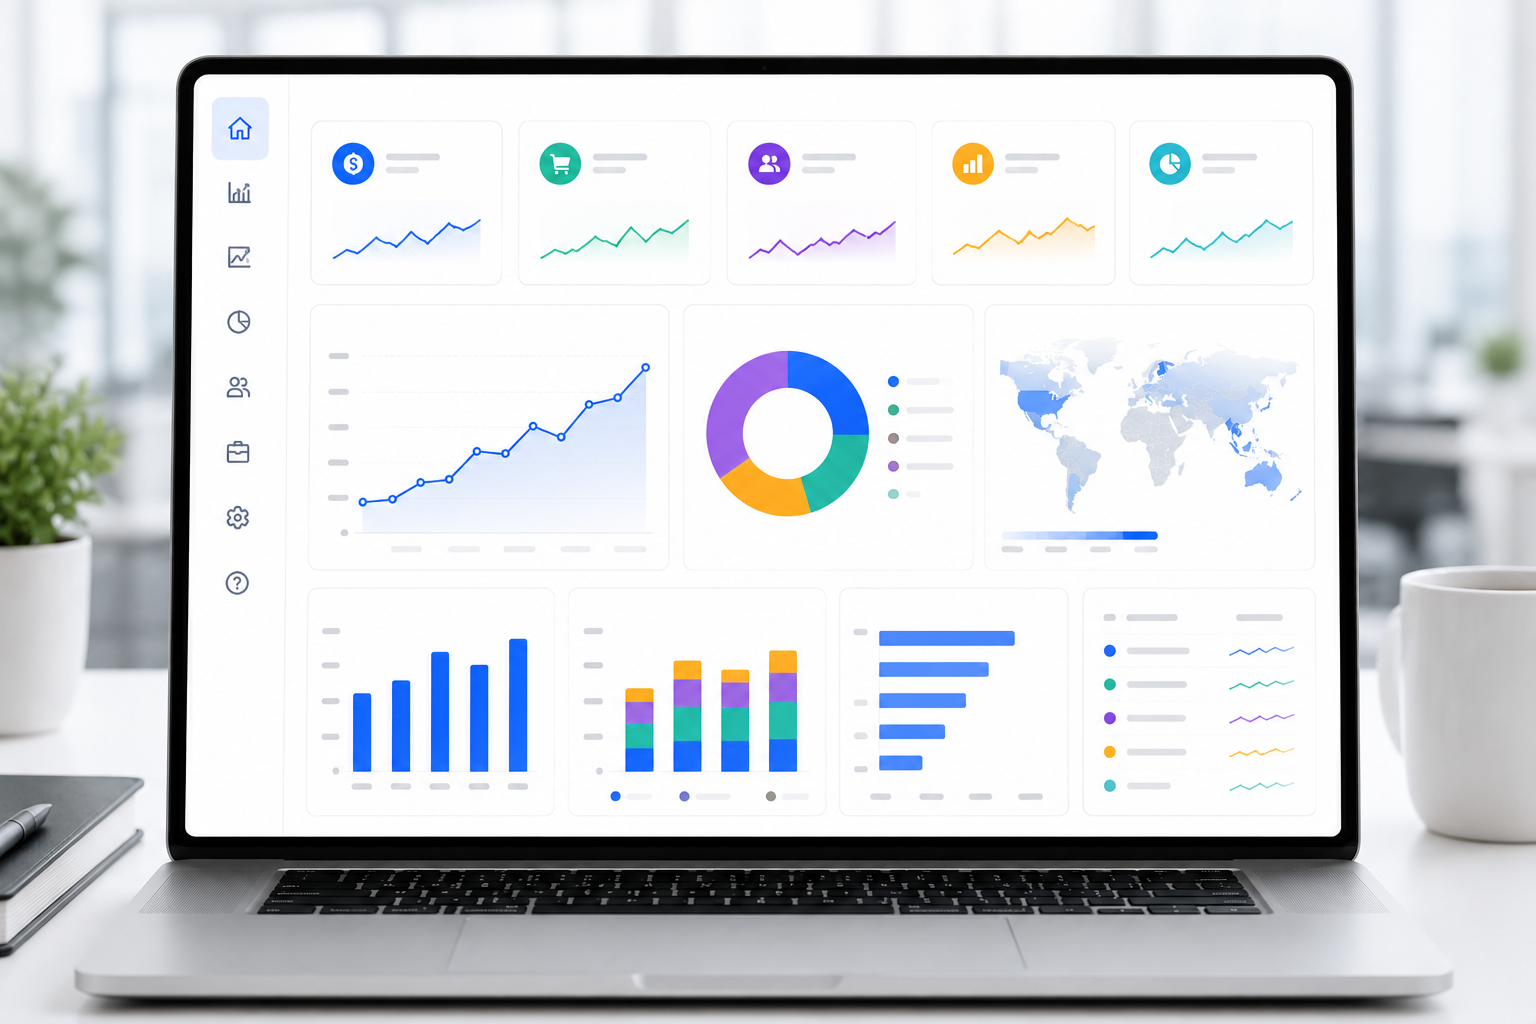
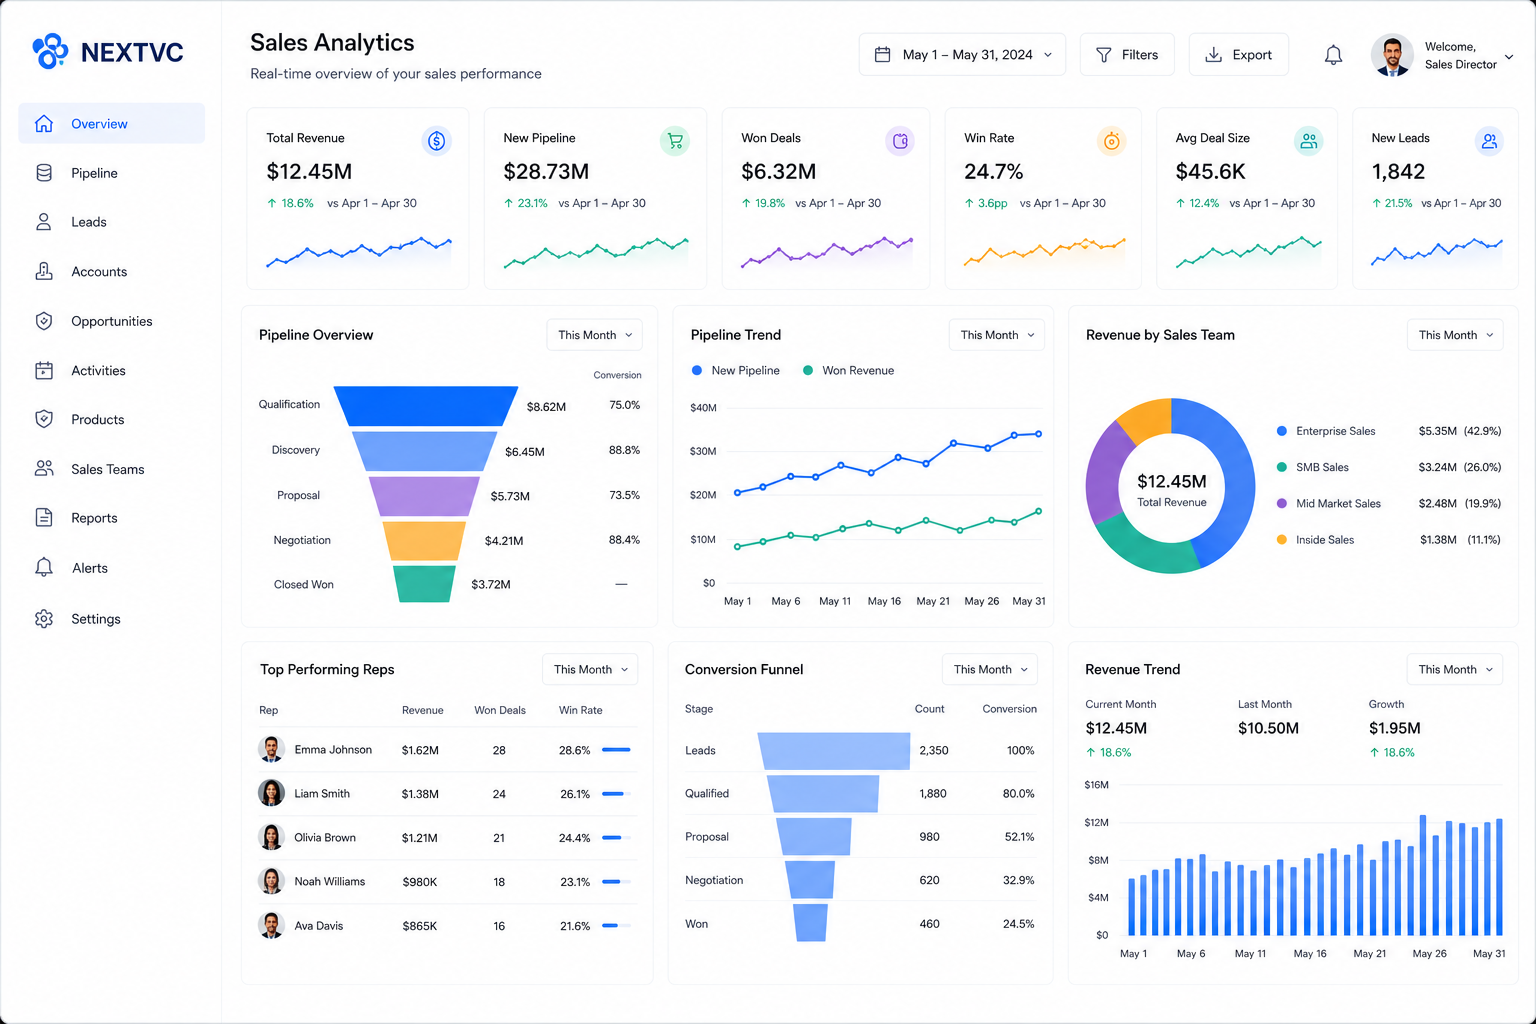
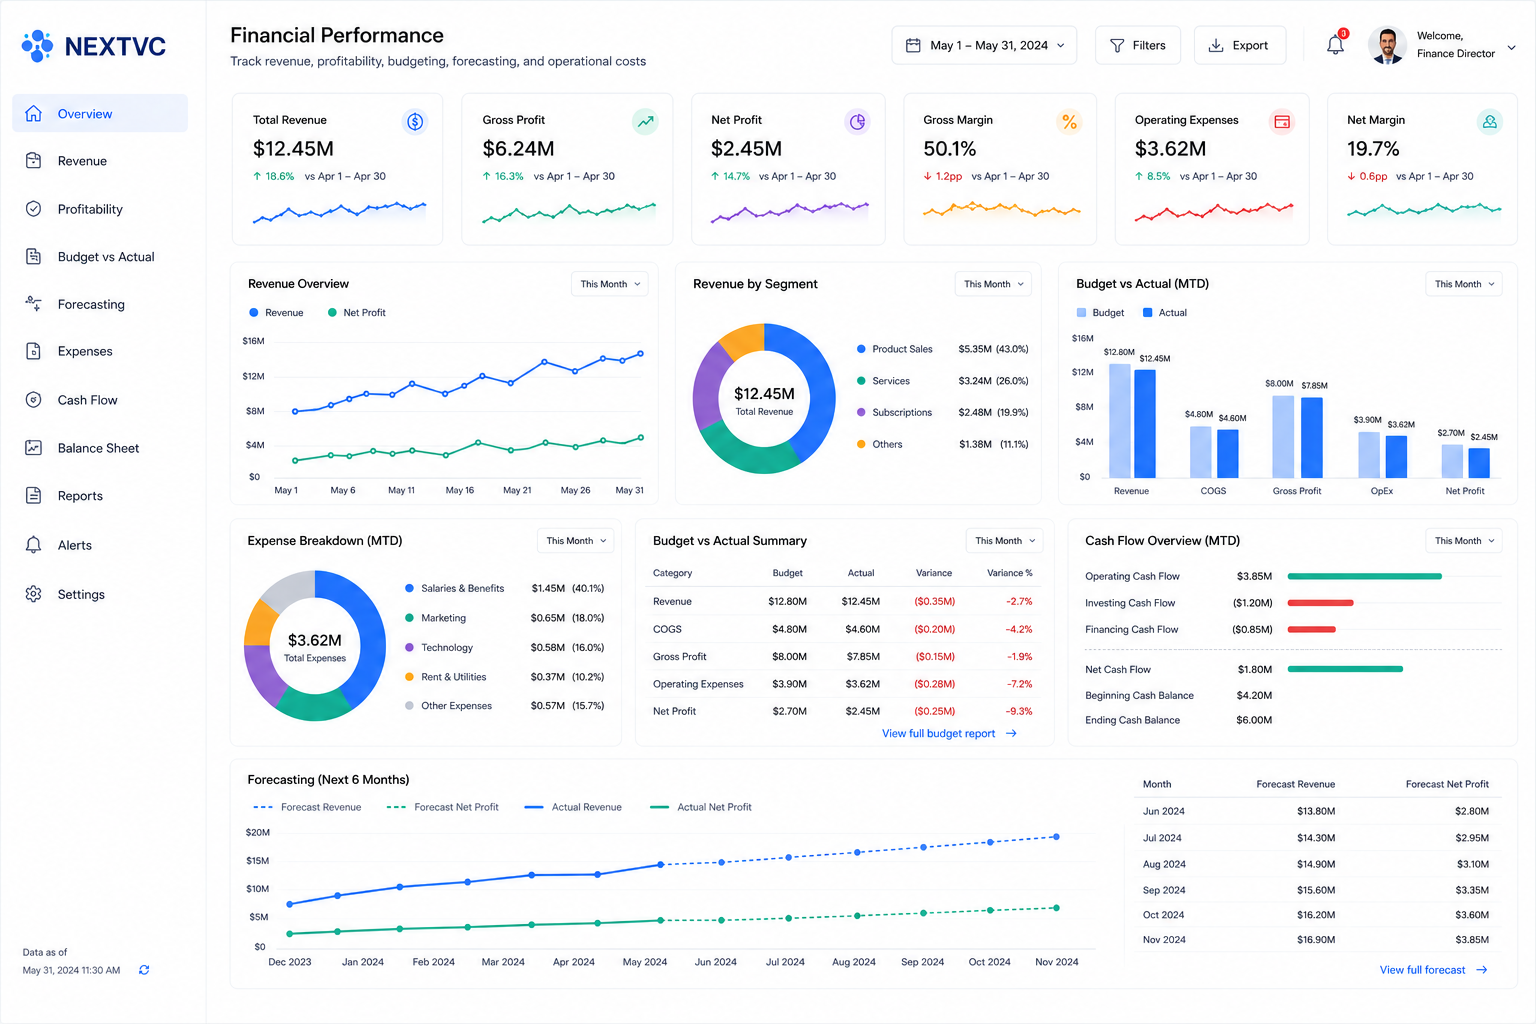
Industries We Serve
Delivering Power BI dashboard solutions across diverse industries
Manufacturing
Production reporting, inventory monitoring, operational dashboards, and supply chain visibility.
Retail & E-Commerce
Sales performance, customer analytics, inventory reporting, and revenue intelligence.
Healthcare
Operational reporting, patient analytics, staffing insights, and resource optimization.
Financial Services
Financial dashboards, profitability monitoring, budgeting, and executive reporting.
SaaS & Technology
Subscription analytics, customer retention monitoring, growth reporting, and product performance.
Professional Services
Project profitability, resource allocation, utilization reporting, and performance monitoring.
Technology Stack & Capabilities
Enterprise-grade tools and platforms for powerful dashboard solutions
Frequently Asked Questions
Find answers to common questions about Power BI dashboard development
What is Power BI?
Power BI is Microsoft's business intelligence and analytics platform that enables organizations to connect data sources, create interactive dashboards, and generate automated reports with powerful visualization capabilities.
Why choose Power BI for dashboards?
Power BI offers powerful visualization, real-time reporting, interactive dashboards, seamless integration with business systems, and enterprise-grade scalability for organizations of all sizes.
How does Power BI compare to Excel?
While Excel is useful for data analysis, Power BI excels at handling large datasets, creating real-time dashboards, automating reporting, and providing interactive visualizations that scale to enterprise requirements.
What's the cost of Power BI development?
Cost varies based on dashboard complexity, data sources, customization requirements, and integration needs. We offer flexible engagement models ranging from focused projects to comprehensive reporting platforms.
How long does implementation take?
Implementation timelines typically range from 4-12 weeks depending on complexity, data sources, dashboard scope, and integration requirements. We prioritize quick wins and deploy dashboards in phases.
Can Power BI connect to multiple data sources?
Yes. Power BI integrates with CRM systems, ERP platforms, accounting software, databases, APIs, spreadsheets, cloud platforms, and custom business applications for seamless data consolidation.
Does Power BI support real-time reporting?
Yes. We can configure Power BI dashboards to display real-time or near real-time business data depending on your systems and data architecture for immediate operational visibility.
What's included in your Power BI services?
We provide complete Power BI services including dashboard design and development, data integration, report automation, training, support, and ongoing optimization to ensure your dashboards deliver continuous value.
How do you ensure dashboard adoption?
We ensure adoption through intuitive design, stakeholder involvement from the beginning, comprehensive user training, change management support, and ongoing optimization based on user feedback and usage patterns.